
Two REITs may each report that 30% of net operating income comes from the same coastal state. On a conventional allocation table, the exposures can look broadly comparable.
But the underlying properties may be very different. One portfolio may hold newer buildings several miles inland and at higher elevation; the other may own older assets closer to the water, with aging roof systems and a different set of hazard characteristics.
That difference may matter to an insurance underwriter, a lender, or an investor assessing the durability of property-level cash flows. Yet it may not be visible in a state-level or metropolitan-area portfolio summary. The gap between what can be measured at the building and what appears in a conventional portfolio report is the starting point for this discussion.
The Limits of Broad Geography
In March 2026, the National Association of Insurance Commissioners announced a nationwide homeowners market data call requiring insurers to report at the ZIP code level on premiums, deductibles, non-renewals, coverage limits, and mitigation discounts across policy years 2018 through 2025. The data call also requests claims and losses by peril, cancellations, replacement-cost and actual-cash-value information, and other policy-level indicators. Regulators described the initiative as the most comprehensive collection of homeowners insurance policy data undertaken in the United States, with a public report planned for early 2027.
The decision to collect data at the ZIP-code level is the notable point. State-level information did not offer enough detail for regulators seeking to understand how insurance-market conditions vary within a state.
The data call covers homeowners insurance and does not directly govern, measure, or predict conditions in listed commercial real estate. Its broader lesson is useful, however: when a risk varies materially from one location to another, broad geographic categories can obscure information that matters.
The same limitation can apply to listed real estate. State and metropolitan-area disclosures are useful for understanding economic exposure, demand trends, regulation, and regional diversification. They do not necessarily reveal the physical characteristics of the individual properties that generate a REIT’s income.
The Portfolio Summary Problem
Advisors already use a developed toolkit when evaluating listed real estate: sector composition, income and dividend characteristics, lease structure and duration, balance-sheet quality, leverage, debt maturity profiles, and interest-rate sensitivity. These measures remain essential.
The FTSE Nareit U.S. Real Estate Index Series tracks the U.S. REIT industry both broadly and by property sector, reflecting the role sector analysis plays in evaluating listed real estate exposure.
The limitation is not that traditional measures are insufficient. It is that geographic exposure is often reported at a level of aggregation that supports broad economic analysis while revealing little about the physical characteristics of individual buildings.
REITs generally report geography by state or metropolitan area in their public filings. This can be useful for understanding regional exposure. It can also leave important distinctions invisible. A portfolio may appear diversified by issuer, tenant, sector, and broad geography while still holding properties with exposure to similar perils in similar locations.
That is not a claim that every portfolio contains hidden concentration. It is a recognition that a state or metropolitan allocation can combine buildings with materially different exposure profiles into a single line item.
A coastal state, for example, can include elevated inland properties, low-lying waterfront assets, newer construction, older buildings, assets with different roof conditions, and properties exposed to different combinations of wind, flood, hail, wildfire, heat, or drainage-related risk. A portfolio summary may capture the state. It does not necessarily capture the distinctions within it.
Asset Location and Economic Exposure
Physical-risk analysis is often reduced to a discussion of weather. For real estate investors, the economic question is broader: where are the assets, what characteristics do they have, and how much value is concentrated in locations where losses may occur?
Swiss Re Institute reported that global insured losses from natural catastrophes reached $107 billion in 2025. Wildfires, severe convective storms, and floods accounted for 92% of the global insured-loss total.
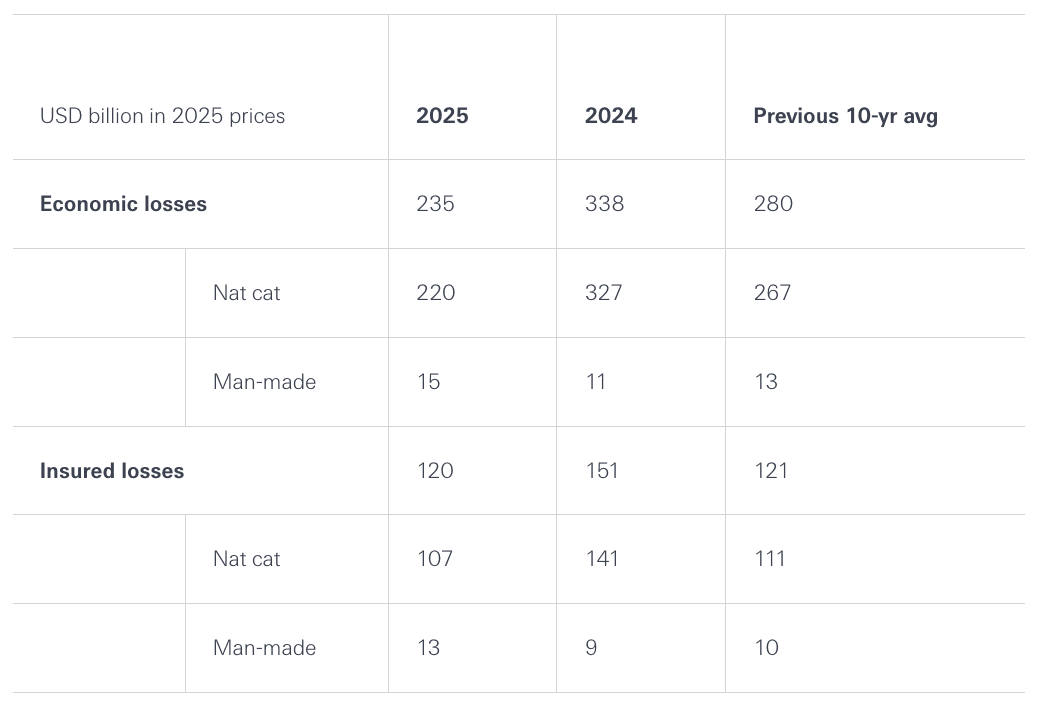
Source: Swiss Re Institute. Wildfires, Storms, Floods Contribute to Record 92% of Global Insured Losses in 2025.
For allocators, those figures are not simply evidence of an eventful year. They underscore the financial importance of the assets located in affected areas. As more property is built, acquired, and financed in exposed locations—and as replacement and rebuilding costs rise—the potential economic significance of location can grow as well.
This is an economic lens rather than an advocacy argument. It focuses on the physical characteristics and geographic placement of income-producing assets. If location and property value are material contributors to loss experience, then they are reasonable factors to evaluate alongside the conventional measures already used in REIT analysis.
Insurance-Industry Measurement
Insurers have long assessed property exposure at a more granular level because insurance pricing, risk selection, capital management, and claims obligations depend on it.
Catastrophe models estimate expected loss at a set of coordinates using hazard characteristics and building attributes. The analysis can consider factors such as location, elevation, distance to water, construction type, roof characteristics, and exposure to relevant perils. These models are calibrated against observed event frequency and severity and are updated as data and methodologies evolve.
Their output is an estimate of expected loss, not a forecast of a specific event. It does not predict the next storm, wildfire, flood, or claim. It provides a structured way to assess the characteristics of a property that may not be apparent in issuer-level, state-level, or sector-level reporting.
The Climate Global - Climate-Resilient REIT Index ETF (CLIM) applies insurance-industry climate and extreme-weather analytics at the property and portfolio levels. The analysis begins with the building rather than the issuer, aggregates modeled physical-risk information across a REIT’s underlying properties, and incorporates that information into a disciplined, transparent, rules-based approach to listed real estate exposure.
This does not forecast near-term REIT performance or remove investment risk. It introduces a category of property-level information that conventional market-capitalization and sector-weighting approaches may not capture.
A Different Analytical Question
Climate-related investment analysis is often grouped under ESG. That shorthand can obscure the difference between issuer-level corporate assessment and property-level physical-risk analysis.
ESG-oriented approaches may assess companies through information such as emissions, governance practices, disclosure quality, policies, and qualitative or quantitative scores. Their primary unit of analysis is generally the issuer.
Property-level physical-risk analysis begins elsewhere. It evaluates the building, uses modeled expected-loss information as an input, and develops a portfolio view upward from the properties themselves.
These approaches can answer different questions.
CLIM’s methodology is focused on physical climate risk and does not rely on emissions metrics, broad ESG scores, or exclusionary screens as the basis for its property-level risk analysis.
For advisors, the distinction is practical. The issue is not whether one framework is universally better than another. It is whether the framework being used is designed to evaluate the exposure that matters to the allocation under review.
Portfolio Context
Traditional REIT analysis and market-capitalization-weighted real estate exposure remain useful. Property-level physical-risk analysis is not intended to replace sector, valuation, balance-sheet, income, or interest-rate analysis. It adds another lens to the evaluation of listed real estate.
For advisors, CLIM may be considered within a listed-real-estate, real-assets, or thematic allocation, subject to a client’s objectives, time horizon, risk tolerance, existing holdings, and broader portfolio construction. Directly owned real estate and private real-estate exposure may also be relevant, particularly because those holdings are not fully reflected in public-company portfolio disclosures.
No methodology of this kind removes uncertainty. Models can be wrong in direction and magnitude, and their outputs can change as data and methods are revised. REITs remain subject to equity-market risk, interest-rate sensitivity, sector concentration, model risk, and the unpredictability of future weather and economic conditions.
Property-level physical-risk analysis can differentiate exposure. It cannot eliminate uncertainty, prevent losses, or make a portfolio safer. A portfolio using these analytics is assembled differently—not made risk-free.
Resolution Matters
Market capitalization, sector classification, and broad geography remain useful ways to understand listed real estate. They do not necessarily reveal what sits beneath them.
When exposure varies from one building to the next, the relevant question is not whether an allocation table is wrong. It is whether it has enough resolution to show the characteristics an advisor may want to evaluate.
Sources
National Association of Insurance Commissioners. State Insurance Regulators Issue Nationwide Homeowners Market Data Call.
National Association of Insurance Commissioners. 2026 Homeowners Market Data Call.
Swiss Re Institute. sigma 1/2026: Natural Catastrophes in 2025—The Persistent Rise of Wildfire and Storm Risk.
Swiss Re Institute. Wildfires, Storms, Floods Contribute to Record 92% of Global Insured Losses in 2025.
Nareit. FTSE Nareit U.S. Real Estate Index Series.
Carefully consider the Funds’ investment objectives, risk factors, charges and expenses before investing. This and additional information can be found in the Fund’s Prospectus and Summary Prospectus, which may be obtained by visiting www.climateglobaletf.com. Read the Prospectus and Summary Prospectus carefully before investing.
The Fund is distributed by Foreside Fund Services, LLC. Exchange Traded Concepts, LLC serves as the investment advisor. The Fund is distributed by Foreside Fund Services, LLC., which is not affiliated with Climate Global, Exchange Traded Concepts, LLC, or any of its affiliates.
Investing involves risk, including possible loss of principal. The Fund’s return may not match or achieve a high degree of correlation with the return of the Index. To the extent the Fund’s investments are concentrated in or have significant exposure to a particular issuer, industry or group of industries, or asset class, the Fund may be more vulnerable to adverse events affecting such issuer, industry or group of industries, or asset class than if the Fund’s investments were more broadly diversified. Issuer-specific events, including changes in the financial condition of an issuer, can have a negative impact on the value of the Fund.
A new or smaller fund is subject to the risk that its performance may not represent how the fund is expected to or may perform in the long term. In addition, new funds have limited operating histories for investors to evaluate and new and smaller funds may not attract sufficient assets to achieve investment and trading efficiencies.
Shares are bought and sold at market price (closing price) not net asset value (NAV) and are not individually redeemed from the Fund. Market price returns are based on the midpoint of the bid/ask spread at 4:00pm Eastern Time (when NAV is normally determined) and do not represent the return you would receive if you traded at other times. Brokerage commissions will reduce returns.
