How insurers use catastrophe models to price risk
Catastrophe modeling is one of the most important—and least understood—analytical frameworks shaping how physical risk is priced, transferred, and absorbed across the global economy.
The Scale of the Problem
$4T+
Global economic losses since 1980 [1]
400+
U.S. billion-dollar disasters since 1980 [2]
$2.9T
Cumulative U.S. disaster costs
(inflation-adjusted)
The trend is clear: average annual disaster counts rose from fewer than 5 events per year in the 1980s to over 20 events per year since 2020.
The Protection Gap
Insured losses represent only 35–40% of total economic losses. The protection gap—the difference between economic and insured losses—represents risk that falls directly on property owners, governments, and communities.
Why Catastrophe Modeling Exists
Traditional insurance pricing relied on backward-looking averages: historical claims, regional loss ratios, and qualitative judgment. That approach began to fail as rare, high-severity events dominated loss outcomes.
The Turning Point: Hurricane Andrew (1992)
Hurricane Andrew caused approximately $27 billion in losses (1992 dollars), far exceeding insurer expectations and contributing to multiple insurer insolvencies. The lesson was clear: rare events dominate long-term loss distributions and cannot be understood through short historical samples alone. [3]
Catastrophe modeling emerged to answer three fundamental questions:
1. What events are physically possible?
2. How often might they occur?
3. What would they cost if they did?
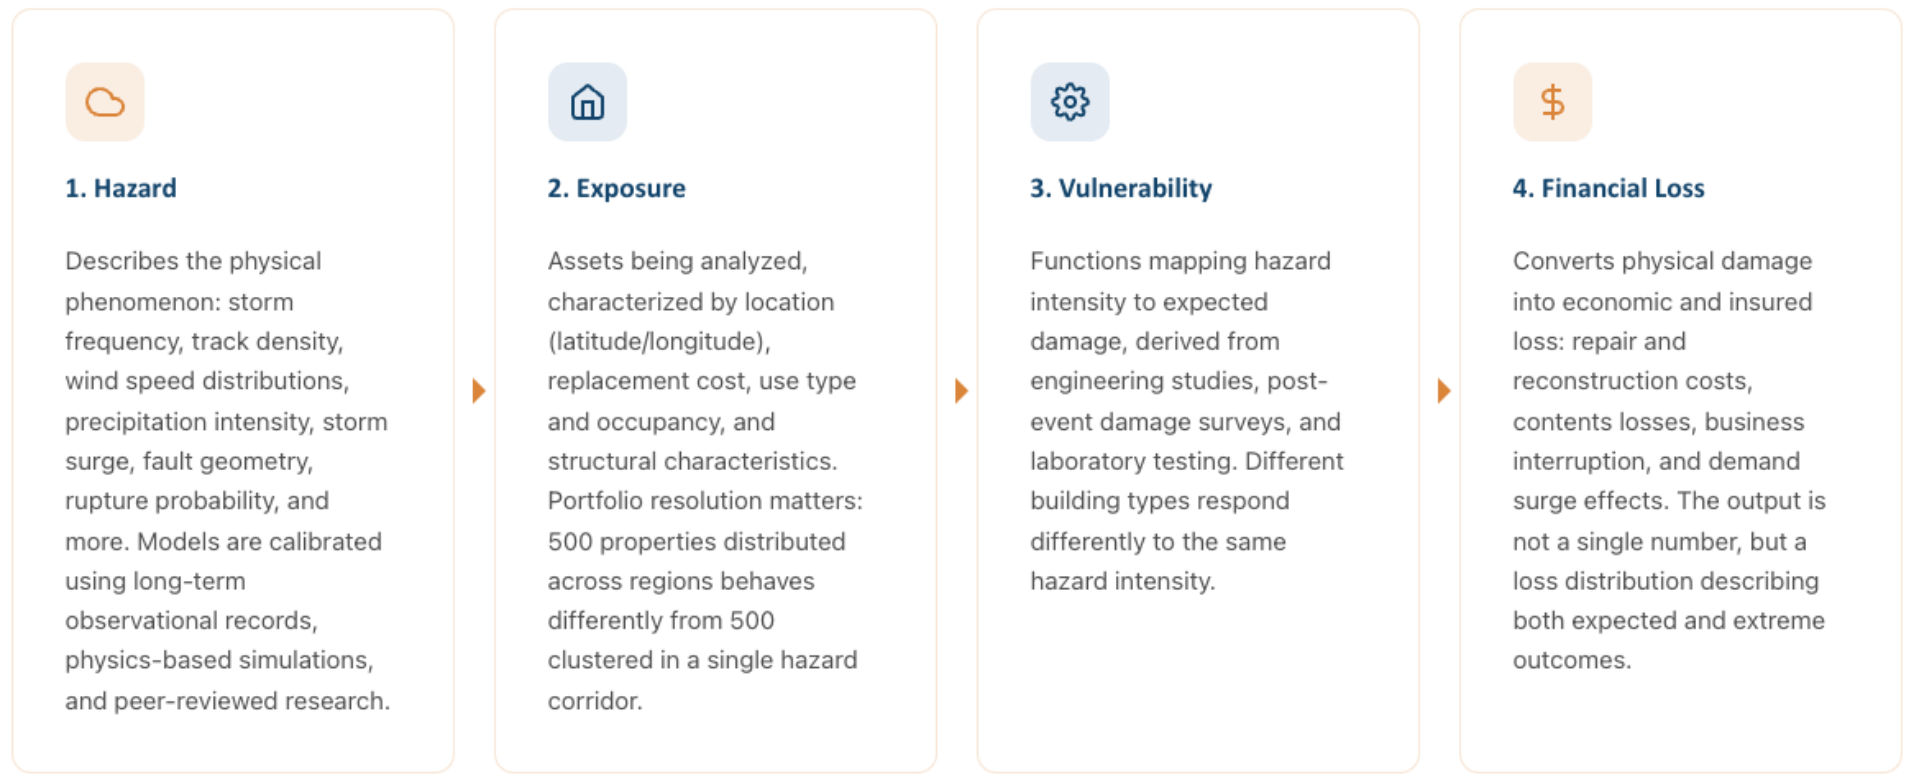
Four Integrated Components
Why Insurers Depend on These Models
Insurers are capital-constrained entities. Regulators require solvency under extreme but plausible scenarios (e.g., “1-in-200-year” events). Catastrophe models are used to:
• Set underwriting limits by region and peril
• Price insurance policies and deductibles
• Structure reinsurance programs
• Allocate capital across lines of business
• Satisfy regulatory stress-testing requirements
Reinsurers, whose portfolios are globally diversified but highly tail-exposed, rely on these models even more heavily. Their business depends on accurately pricing catastrophic risk across geographies and perils.
Beyond Insurance
As catastrophe losses grow and insurance markets reprice risk, these models become relevant far beyond the insurance industry. They now inform decision-making for:
• Real asset owners — Evaluating long-term property durability
• Infrastructure investors — Assessing physical risk in long-duration assets
• Banks and lenders — Understanding collateral risk and mortgage exposure
• Index providers — Incorporating physical risk into investment products
• Regulators and policymakers — Stress-testing financial system resilience
Catastrophe models provide a common quantitative language for discussing physical risk across markets—connecting insurers, investors, and policymakers through shared analytical frameworks.
Portfolio Aggregation: Correlation Matters
One of the most important insights: losses are not independent. A single hurricane can affect thousands of properties simultaneously. A major flood can impair an entire metropolitan region.
Portfolio aggregation explicitly models spatial correlation. This is why geographic concentration is often more important than asset count when assessing risk. For asset owners, diversification must be evaluated spatially, not just numerically.
Geographic concentration is often more important than asset count when assessing risk.
Key Takeaway
Catastrophe modeling exists because rare events dominate real-world losses, and historical averages are insufficient. By combining physical science, engineering, and probabilistic simulation, these models provide structured insight into how physical risk translates into financial outcomes.
They don’t predict the future—they frame uncertainty in measurable, comparable terms.
Sources:
[1] PreventionWeb, https://www.preventionweb.net/publication/documents-and-publications/climate-risk-index-2026, captured 2/18/2025
[2] NOAA, https://www.ncei.noaa.gov/access/billions/summary-stats#temporal-comparison-stats, captured 2/18/2025
[3] https://www.weather.gov/news/220822-hurricane-andrews, captured 2/18/2025
Carefully consider the Funds’ investment objectives, risk factors, charges and expenses before investing. This and additional information can be found in the Fund’s Prospectus and Summary Prospectus, which may be obtained by visiting www.climateglobaletf.com. Read the Prospectus and Summary Prospectus carefully before investing.
The Fund is distributed by Foreside Fund Services, LLC. Exchange Traded Concepts, LLC serves as the investment advisor. The Fund is distributed by Foreside Fund Services, LLC., which is not affiliated with Climate Global, Exchange Traded Concepts, LLC, or any of its affiliates.
Investing involves risk, including possible loss of principal. The Fund’s return may not match or achieve a high degree of correlation with the return of the Index. To the extent the Fund’s investments are concentrated in or have significant exposure to a particular issuer, industry or group of industries, or asset class, the Fund may be more vulnerable to adverse events affecting such issuer, industry or group of industries, or asset class than if the Fund’s investments were more broadly diversified. Issuer-specific events, including changes in the financial condition of an issuer, can have a negative impact on the value of the Fund.
A new or smaller fund is subject to the risk that its performance may not represent how the fund is expected to or may perform in the long term. In addition, new funds have limited operating histories for investors to evaluate and new and smaller funds may not attract sufficient assets to achieve investment and trading efficiencies.
Shares are bought and sold at market price (closing price) not net asset value (NAV) and are not individually redeemed from the Fund. Market price returns are based on the midpoint of the bid/ask spread at 4:00pm Eastern Time (when NAV is normally determined) and do not represent the return you would receive if you traded at other times. Brokerage commissions will reduce returns.
