How Heat Stress Affects Real Estate
Heat damage doesn't come in one big event. It compounds — in operating costs, in wear, and in demand.
- HVAC cost surge — cooling bills climbing sharply in the hottest markets
- Equipment wear — chillers, compressors, and rooftop units fail faster
- Roofing breakdown — membranes and shingles degrade under sustained high heat
- Building envelope stress — thermal cycling shortens the life of facades and seals
- Tenant retention — livability and productivity decline in chronically hot markets
- Insurance opacity — heat risk is rarely a named peril on policies
- Migration pressure — demand shifts as markets get less comfortable to live in
Location Is Everything
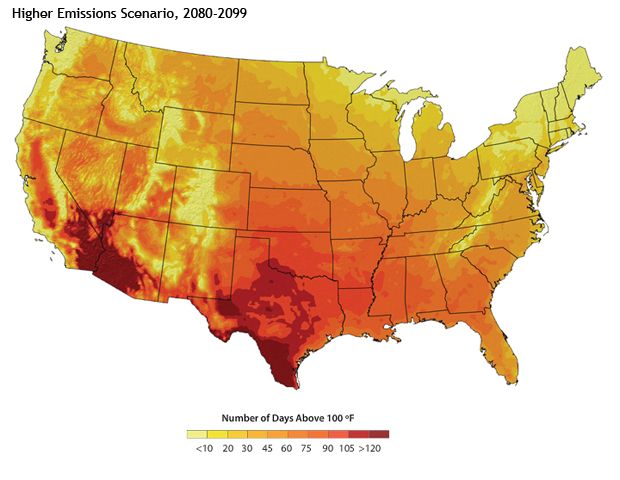
Extreme-heat exposure is already uneven and getting more so. This NOAA Climate.gov projection shows expected annual days above 100°F across the U.S. by 2080–2099 under a higher-emissions path. The Sun Belt and Mountain West absorb the biggest increases — but even parts of the East Coast move into Texas-today territory. [1]
Two REITs with apartment or industrial exposure in the Sun Belt can have very different heat economics depending on which metros, which neighborhoods, and which building stock they own.
Source: NOAA Climate.gov
How Heat Stress Works — and Why It's Getting Worse
Heat stress isn't just uncomfortable summers. It's what happens when the human body can no longer cool itself down. When air temperature combines with humidity, the "feels like" heat index can be 10–20°F higher than the thermometer reads. Above a heat index of 103°F, the body struggles to shed heat even in the shade. Above 124°F, extended exposure can be fatal.
Cities make this worse. Buildings, pavement, and rooftops absorb heat during the day and release it at night — the urban heat island effect. In Phoenix, Miami, and Houston, overnight lows during a heat wave can still exceed 90°F. The body gets no overnight recovery. HVAC systems get no break.
There's a harder physical ceiling called wet-bulb temperature — the lowest temperature a body can reach through sweating. Once the wet bulb passes roughly 35°C (95°F), even a healthy person at rest in the shade with unlimited water cannot shed heat. Outside exposure at that level is as dangerous as a blizzard: exposure kills, and survival depends on getting inside.
Source: Raymond et al., Communications Earth & Environment (2022)
Where Wet Bulb Is Already Dangerous
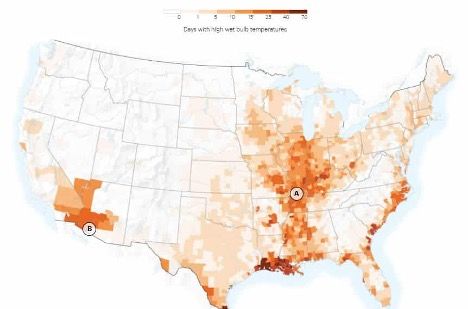
This map shows where on Earth dangerous wet-bulb temperatures are already occurring or projected to spread. The Persian Gulf, South Asia, and parts of the U.S. Southeast have already brushed the survivability threshold. As these thresholds get crossed more often, affected regions become materially less habitable — and, for real estate, materially less desirable. [2]
NOAA data shows all ten of the hottest years on record have occurred since 2010. Heat waves that used to happen once every 50 years are now happening roughly once a decade — and that gap is shrinking. [3]
Where Heat Is Redefining Real Estate
The Sun Belt — Phoenix, Las Vegas, Dallas, Houston, Miami — is on the front lines. Phoenix recorded 31 consecutive days above 110°F in the summer of 2023, with overnight lows barely below 90°F. The city recorded 645 heat-associated deaths that year — its deadliest heat season on record. [4]
The Pacific Northwest showed what heat can do to places not built for it. The June 2021 heat dome sent Portland and Seattle — cities designed for cool, mild weather — past 116°F. Nearly 800 deaths were attributed to the event across Washington and Oregon. [5] Buildings without air conditioning became dangerous within hours. Scientists estimated the event was virtually impossible without climate change.
The Operating Cost Problem
Extreme heat is a chronic risk — it doesn't arrive as one dramatic event but accumulates over years and decades. That makes it easy to miss in a quarterly earnings report. But compounding operating costs, declining livability, shifting migration patterns, and rising insurance premiums are already showing up in the data.
A 2022 study in Communications Earth & Environment by researchers at the University of Washington found that even if warming is limited to the Paris Agreement's 2°C target, exposure to dangerous heat index levels will likely increase 50–100% in the tropics and 3–10 times across the midlatitudes by 2100. For real estate, that's an operating cost curve that keeps bending upward. [6]
What the Market Already Knows
Heat isn't a named peril on most property policies — but lenders, utilities, and insurers are still pricing it. Moody's and MSCI now track chronic heat in their real estate risk tools. Electric utilities in Texas and Arizona price demand charges around peak-heat days. Moody's RMS and other model providers publish multi-decade heat projections that large asset managers already buy. The market is repricing heat quietly, one line item at a time.
Insurance math, not politics
Chronic heat shows up in operating costs, demand, and insurability long before it shows up in the news. Lenders, insurers, and utilities price it on the margin because the claims, the bills, and the move-outs are already landing.
Why This Matters
REITs — real estate investment trusts — own physical buildings in specific locations. A Phoenix apartment REIT has a different cooling-cost curve than a Pacific Northwest one. That's the property-level problem: where a building sits shapes what it's worth.
But portfolios have a second problem. A record heat summer doesn't hit one apartment — it pushes cooling costs up across every building in every Sun Belt market at the same time. That's correlated risk: bets that look different but move together when the grid is pushed to its limit.
The index underlying VNQ (Vanguard Real Estate Index Fund ETF), and most other U.S. real estate funds, weights REITs purely by market capitalization. It doesn't look at how much of a REIT's portfolio sits in chronic-heat metros, or how many REITs in the index share the same Sun Belt exposure.
The index methodology behind the Climate Global - Climate-Resilient REIT Index ETF (CLIM) is built differently. It uses the same catastrophe models insurers use — applied building by building across every REIT — and measures how much of a fund's exposure clusters on the same risk.
Learn more about Climate Global ETF. Click Here.>>
Sources:
[1] Kennedy, Caitlyn. May 24, 2011. “100° Days, Past and Future.” NOAA Climate.gov. https://www.climate.gov/news-features/featured-images/100%C2%B0-days-past-and-future
[2] Raymond, C., Matthews, T. & Horton, R.M. The emergence of heat and humidity too severe for human tolerance. Science Advances 6(19), eaaw1838 (2020). https://doi.org/10.1126/sciadv.aaw1838
[3] NOAA National Centers for Environmental Information. Monthly Global Climate Report for December 2023. Published January 2024. https://www.ncei.noaa.gov/access/monitoring/monthly-report/global/202312; IPCC Working Group I. Climate Change 2021: The Physical Science Basis. Summary for Policymakers, Figure SPM.6. https://www.ipcc.ch/report/ar6/wg1/chapter/summary-for-policymakers/
[4] Maricopa County Department of Public Health. 2023 Heat-Related Deaths Report. Published March 2024, updated January 23, 2025. https://www.maricopa.gov/ArchiveCenter/ViewFile/Item/5820
[5] Philip, S.Y., Kew, S.F., van Oldenborgh, G.J., et al. Rapid attribution analysis of the extraordinary heat wave on the Pacific coast of the US and Canada in June 2021. Earth System Dynamics 13, 1689–1713 (2022). https://doi.org/10.5194/esd-13-1689-2022; World Weather Attribution. July 7, 2021. “Western North American extreme heat virtually impossible without human-caused climate change.” https://www.worldweatherattribution.org/western-north-american-extreme-heat-virtually-impossible-without-human-caused-climate-change/
[6] Vargas Zeppetello, L.R., Raftery, A.E. & Battisti, D.S. Probabilistic projections of increased heat stress driven by climate change. Communications Earth & Environment 3, 183 (2022). https://doi.org/10.1038/s43247-022-00524-4
Carefully consider the Funds’ investment objectives, risk factors, charges and expenses before investing. This and additional information can be found in the Fund’s Prospectus and Summary Prospectus, which may be obtained by visiting www.climateglobaletf.com. Read the Prospectus and Summary Prospectus carefully before investing.
The Fund is distributed by Foreside Fund Services, LLC. Exchange Traded Concepts, LLC serves as the investment advisor. The Fund is distributed by Foreside Fund Services, LLC., which is not affiliated with Climate Global, Exchange Traded Concepts, LLC, or any of its affiliates.
Investing involves risk, including possible loss of principal. The Fund’s return may not match or achieve a high degree of correlation with the return of the Index. To the extent the Fund’s investments are concentrated in or have significant exposure to a particular issuer, industry or group of industries, or asset class, the Fund may be more vulnerable to adverse events affecting such issuer, industry or group of industries, or asset class than if the Fund’s investments were more broadly diversified. Issuer-specific events, including changes in the financial condition of an issuer, can have a negative impact on the value of the Fund.
A new or smaller fund is subject to the risk that its performance may not represent how the fund is expected to or may perform in the long term. In addition, new funds have limited operating histories for investors to evaluate and new and smaller funds may not attract sufficient assets to achieve investment and trading efficiencies.
Shares are bought and sold at market price (closing price) not net asset value (NAV) and are not individually redeemed from the Fund. Market price returns are based on the midpoint of the bid/ask spread at 4:00pm Eastern Time (when NAV is normally determined) and do not represent the return you would receive if you traded at other times. Brokerage commissions will reduce returns.
