How Hurricanes Affect Real Estate
A single storm can rewrite the economics of an entire region overnight.
- Catastrophic damage — wind, storm surge, and rainfall flooding in a single event
- Insurance collapse — private carriers pulling out of Florida and Louisiana
- Premium shock — coastal premiums doubling overnight after major landfalls
- Mortgage friction — no insurance, no loan, no sale
- Business interruption — extended power outages, supply-chain disruption, tenant loss
- Rebuild cost spirals — materials and labor surge after a major season
- Coverage gaps — wind and flood policies price and pay separately
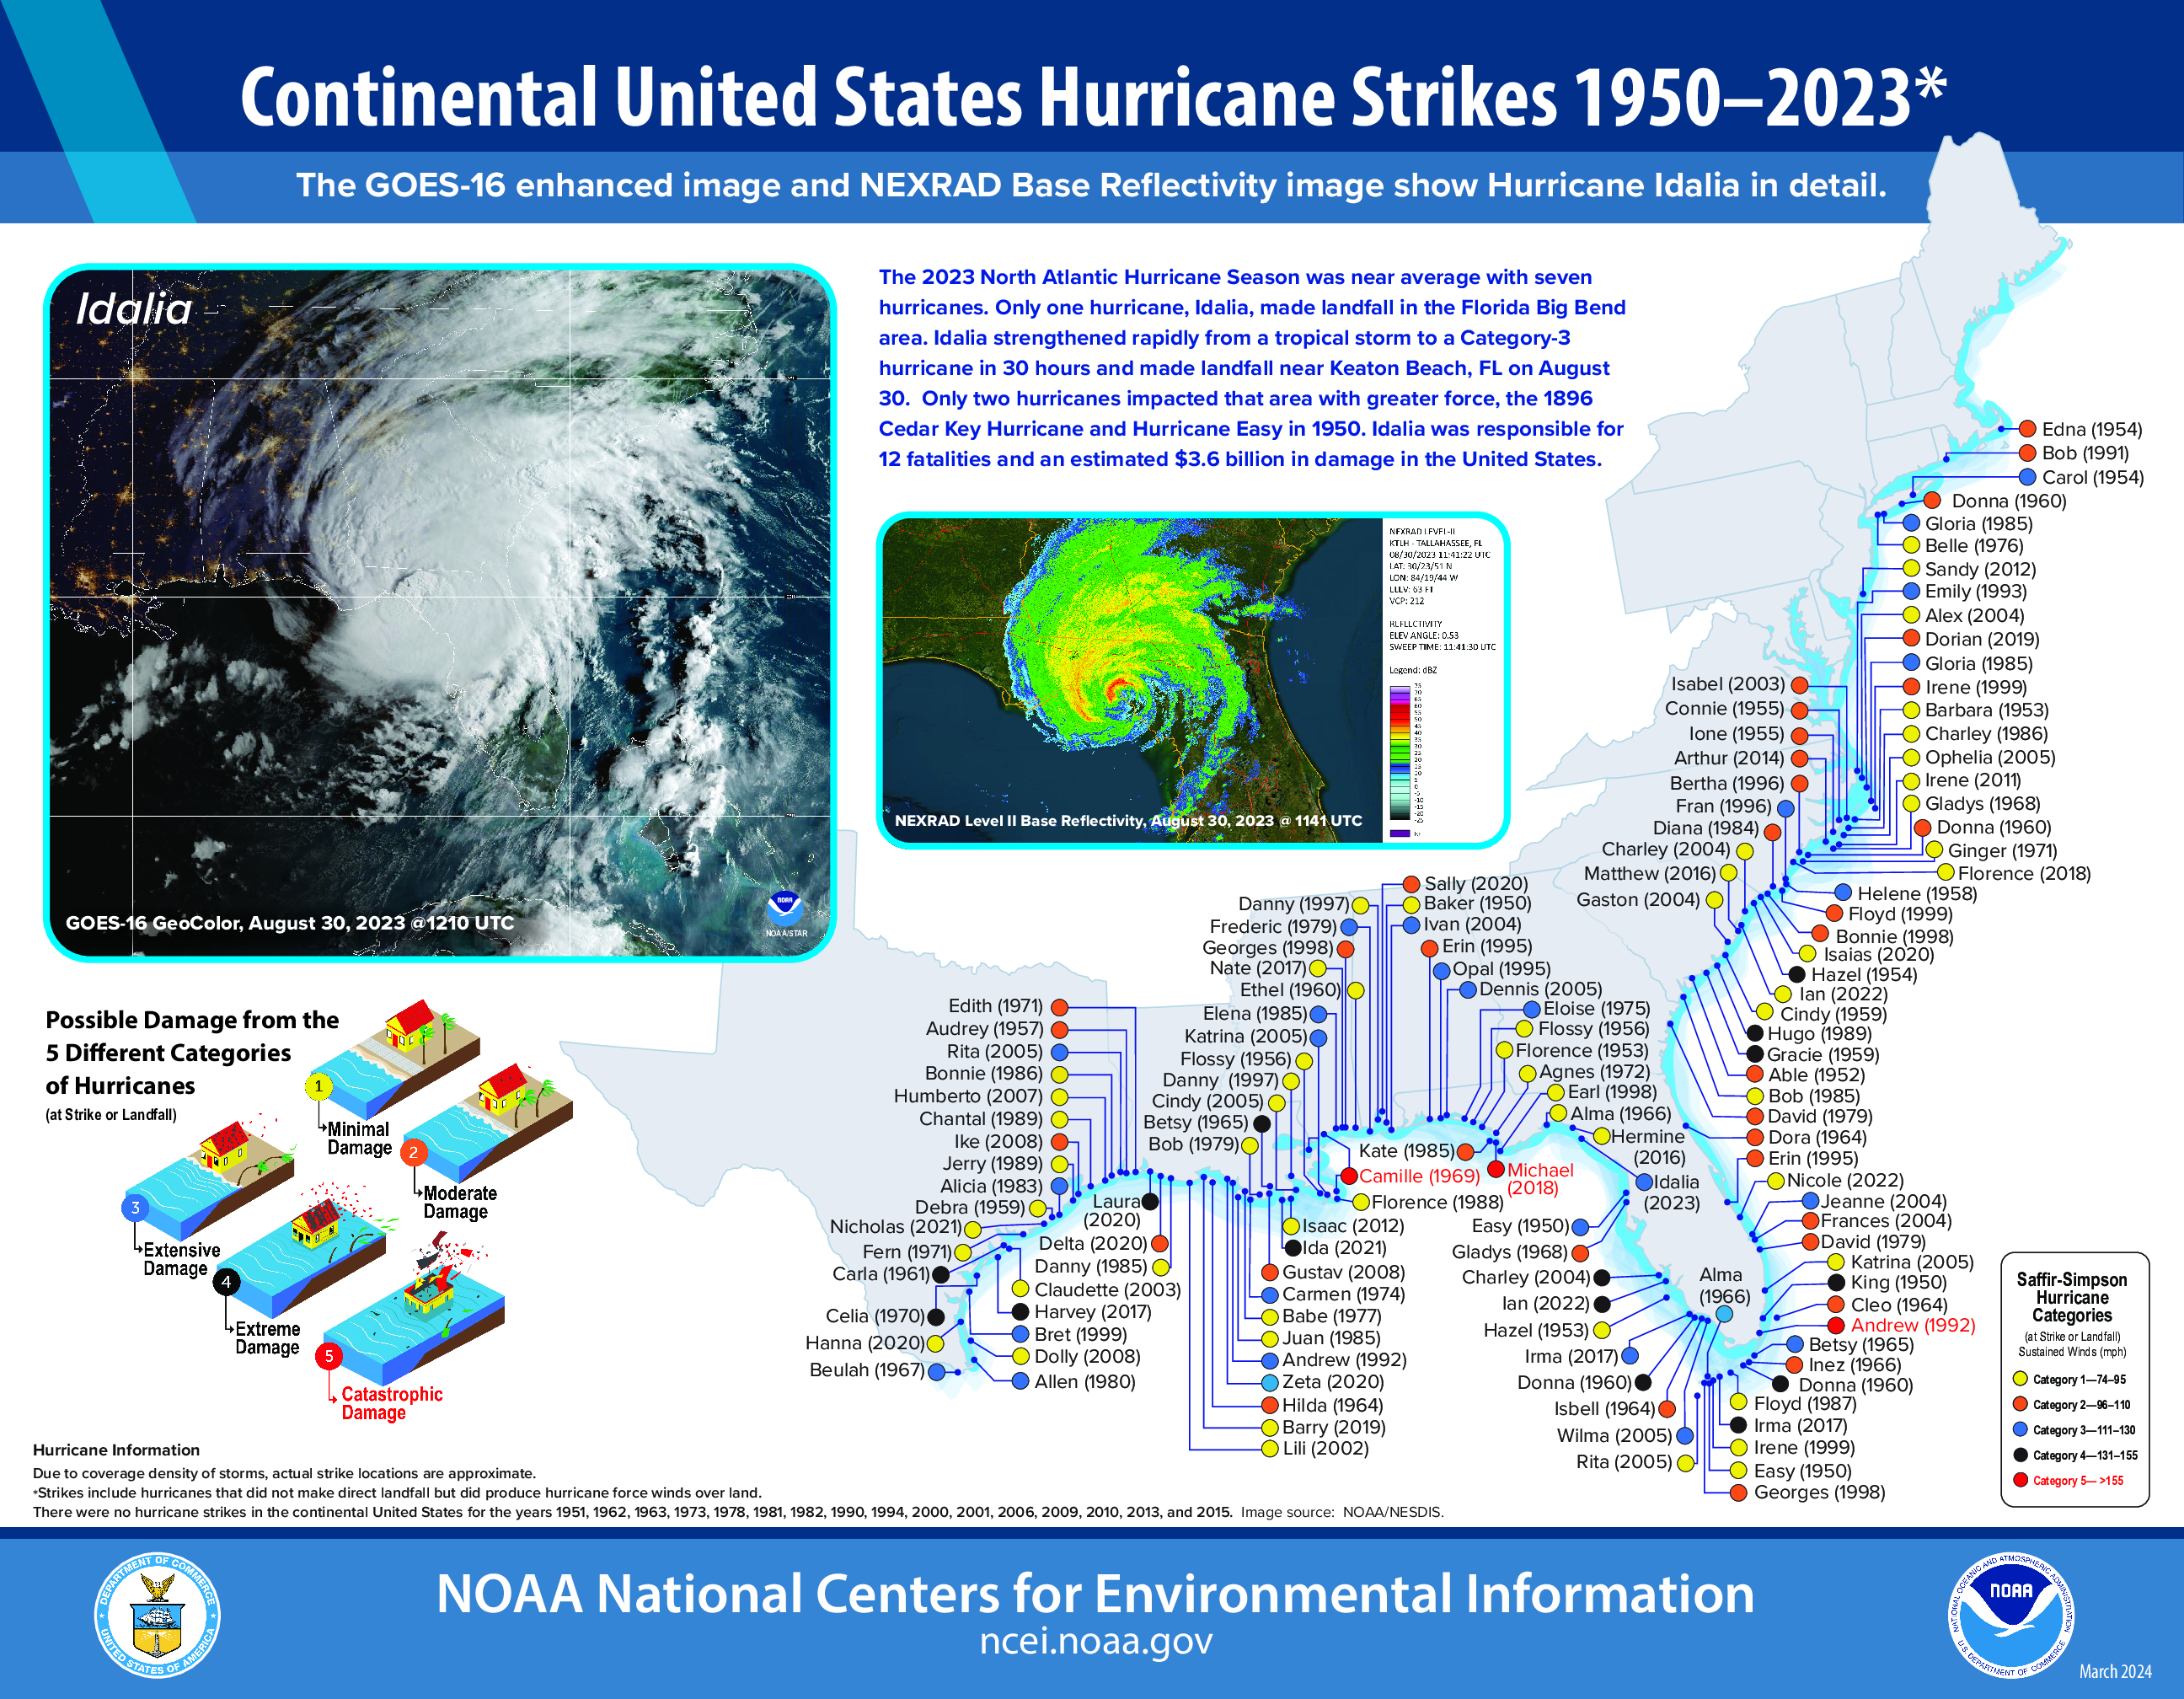
Location Is Everything
Hurricane risk hugs the coasts — and it's not even across them. This NOAA map of U.S. hurricane strikes from 1950 to 2023 shows south Florida and the Gulf Coast getting hit repeatedly, the Carolinas and Mid-Atlantic less often, and the Northeast less often still but at enormous cost when a storm does arrive. [1]
Two REITs can both hold coastal property and still have wildly different storm exposure — it depends on exactly which coastlines, which counties, and which buildings.
NOAA National Hurricane Center: 1950-2023 CONUS Hurricane Strikes (Courtesy of NCEI)
How Hurricanes Work — and Why They're Getting Worse
A hurricane starts as a cluster of thunderstorms over warm ocean water. When sea surface temperatures hit around 79°F, warm air rises fast, releases energy, and spins the storm into a tight rotating system. The warmer the water, the stronger the storm can get — sometimes reaching wind speeds over 150 mph.
Here's what's changed: oceans are warmer now than at any point in recorded history. That means storms can strengthen faster than they used to — scientists call it rapid intensification, when a storm gains 40 mph of wind speed in just 24 hours. Research published in Nature Climate Change confirms it's happening more often. [2] That's the difference between time to evacuate and no warning at all.
Where Hurricanes Are Redefining Real Estate
The Gulf Coast — Texas, Louisiana, Mississippi, and Alabama — is ground zero. The Gulf's warm, shallow water lets storms strengthen right up until landfall. Hurricane Katrina (2005) killed more than 1,800 people and caused over $190 billion in damages, adjusted for inflation. Hurricane Harvey (2017) sat over Houston for days, dropping 60 inches of rain and causing $125 billion in losses. [3]
Florida gets hit from two directions — Atlantic storms from the east, Gulf storms from the west. Hurricane Ian (2022) struck near Fort Myers as a Category 4, causing $112 billion in total damages. [4] In 2024, Hurricane Milton rocketed to Category 5 over the Gulf — one of the fastest intensifications ever recorded there — before making landfall at Siesta Key, south of Tampa, as a Category 3. The Tampa Bay region hadn't seen a direct hit from a major hurricane in over a century.
And sea level rise is amplifying all of it. Seas are rising about 3.7 mm per year and accelerating. When a hurricane pushes water inland, it reaches further than it used to — because the starting point is higher. Homes that have never flooded are now flooding.
The Insurance Collapse on the Coast
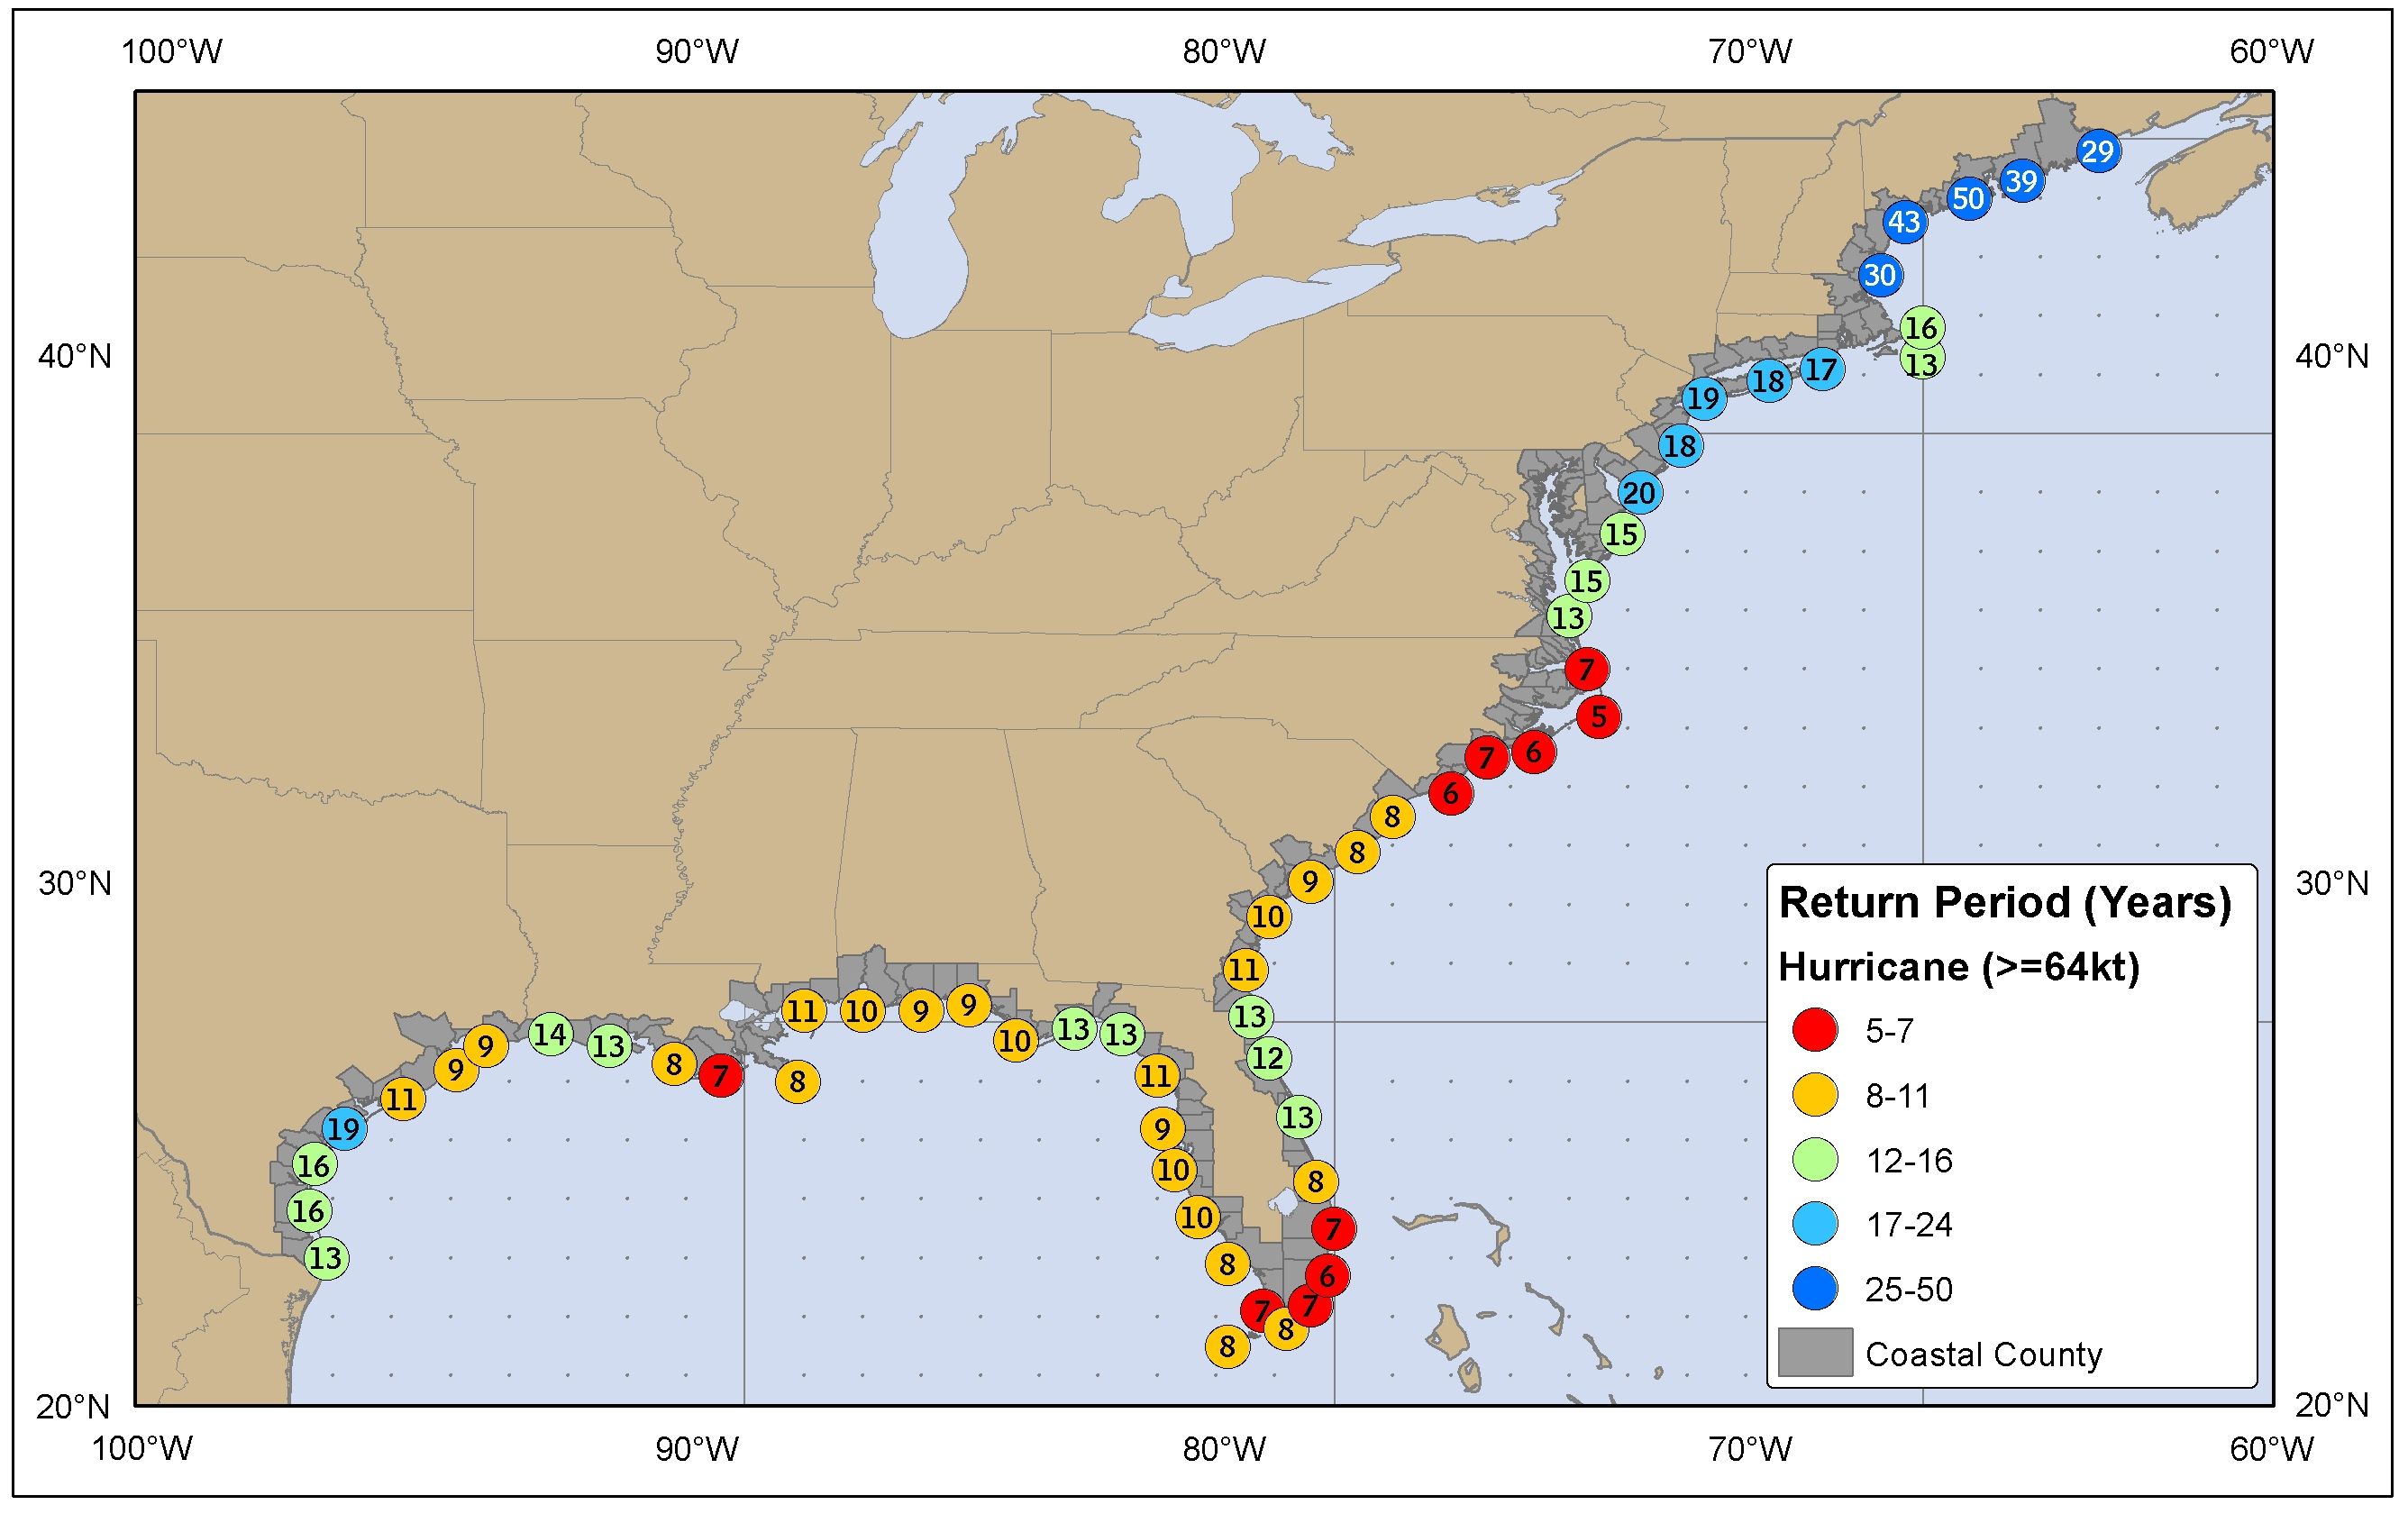
Source: NOAA National Hurricane Center
The Return Period Map Insurers Use
This NOAA map shows hurricane return periods — how often a hurricane passes within 50 miles of a given point. In south Florida it's every few years. Insurance companies have been repricing from maps like this one for years. [5]
You can't get a mortgage without homeowners insurance. So when insurers leave a market, it doesn't just hurt current owners — it makes it nearly impossible to sell.
That's what happened in Florida. Many private insurers have either gone insolvent or stopped writing new policies in coastal counties. Citizens Insurance, Florida's government-backed insurer of last resort, now covers more than 1.2 million homes. In some areas hit by Ian, premiums doubled overnight. In others, coverage disappeared entirely. Louisiana had the same experience after three hurricanes in two years — more than a dozen insurers exited the state.
What Insurers Already Know
Insurance companies have been pricing hurricane risk for decades using catastrophe models — physics-based simulations calibrated against actual claims. Those models show expected losses rising about 7% per year, driven by stronger storms and far more development in coastal areas. Munich Re estimates global hurricane losses now average over $80 billion per year — roughly double what they were in the 1980s. [6]
Insurance math, not politics
Insurers price hurricane risk based on expected losses from catastrophe models, not beliefs about climate policy. When premiums spike or coverage disappears, it's a balance-sheet decision. The claims data is clear: storms are getting stronger, and much of the coast is underinsured.
Why This Matters
REITs — real estate investment trusts — own physical buildings in specific locations. A Gulf Coast industrial REIT faces completely different hurricane economics than a Midwest data center REIT. That's the property-level problem: where a building sits shapes what it's worth.
But portfolios have a second problem. One major hurricane doesn't hit one property — it can damage dozens of buildings in the same REIT, or many REITs in the same index, all at once. That's correlated risk: bets that look different but move together when the storm makes landfall.
The index underlying VNQ (Vanguard Real Estate Index Fund ETF), and most other U.S. real estate funds, weights REITs purely by market capitalization. It doesn't look at how much of a REIT's portfolio sits on the same coastline, or how many REITs in the index share the same hurricane exposure.
The index methodology behind the Climate Global - Climate-Resilient REIT Index ETF (CLIM) is built differently. It uses the same catastrophe models insurers use — applied building by building across every REIT — and measures how much of a fund's exposure clusters on the same risk.
Learn more about Climate Global ETF. Click Here.>>
Sources:
[1] NOAA National Hurricane Center. Tropical Cyclone Climatology. https://www.nhc.noaa.gov/climo/
[2] Bhatia, K., Baker, A., Yang, W., Vecchi, G., Knutson, T., Murakami, H., Kossin, J., Hodges, K., Dixon, K., Bronselaer, B. & Whitlock, C. A potential explanation for the global increase in tropical cyclone rapid intensification. Nature Communications 13, 6626 (2022). https://doi.org/10.1038/s41467-022-34321-6
[3] NOAA National Centers for Environmental Information (NCEI). U.S. Billion-Dollar Weather and Climate Disasters. https://www.ncei.noaa.gov/access/billions/. DOI: 10.25921/stkw-7w73
[4] NOAA National Centers for Environmental Information (NCEI). U.S. Billion-Dollar Weather and Climate Disasters. https://www.ncei.noaa.gov/access/billions/. DOI: 10.25921/stkw-7w73; National Hurricane Center. Tropical Cyclone Report: Hurricane Milton (AL142024), October 5–10, 2024. Published March 31, 2025. https://www.nhc.noaa.gov/data/tcr/AL142024_Milton.pdf
[5] NOAA National Hurricane Center. Tropical Cyclone Climatology. https://www.nhc.noaa.gov/climo/
[6] Munich Re. “Tropical storms — The natural hazard with the highest losses.” https://www.munichre.com/en/risks/natural-disasters/hurricanes.html; Munich Re. “Climate change is showing its claws: The world is getting hotter, resulting in severe hurricanes, thunderstorms and floods.” Natural Disaster Figures 2024. January 9, 2025. https://www.munichre.com/en/company/media-relations/media-information-and-corporate-news/media-information/2025/natural-disaster-figures-2024.html
Carefully consider the Funds’ investment objectives, risk factors, charges and expenses before investing. This and additional information can be found in the Fund’s Prospectus and Summary Prospectus, which may be obtained by visiting www.climateglobaletf.com. Read the Prospectus and Summary Prospectus carefully before investing.
The Fund is distributed by Foreside Fund Services, LLC. Exchange Traded Concepts, LLC serves as the investment advisor. The Fund is distributed by Foreside Fund Services, LLC., which is not affiliated with Climate Global, Exchange Traded Concepts, LLC, or any of its affiliates.
Investing involves risk, including possible loss of principal. The Fund’s return may not match or achieve a high degree of correlation with the return of the Index. To the extent the Fund’s investments are concentrated in or have significant exposure to a particular issuer, industry or group of industries, or asset class, the Fund may be more vulnerable to adverse events affecting such issuer, industry or group of industries, or asset class than if the Fund’s investments were more broadly diversified. Issuer-specific events, including changes in the financial condition of an issuer, can have a negative impact on the value of the Fund.
A new or smaller fund is subject to the risk that its performance may not represent how the fund is expected to or may perform in the long term. In addition, new funds have limited operating histories for investors to evaluate and new and smaller funds may not attract sufficient assets to achieve investment and trading efficiencies.
Shares are bought and sold at market price (closing price) not net asset value (NAV) and are not individually redeemed from the Fund. Market price returns are based on the midpoint of the bid/ask spread at 4:00pm Eastern Time (when NAV is normally determined) and do not represent the return you would receive if you traded at other times. Brokerage commissions will reduce returns.
