How Tornadoes Affect Real Estate
Tornadoes destroy buildings in minutes and reshape insurance markets for years.
- Total loss events — EF4/EF5 tornadoes reduce well-built homes to slabs
- Concentrated damage — a narrow path can destroy hundreds of buildings at once
- No real warning — 15 minutes of lead time at best, versus days for hurricanes
- Deductible shock — percentage-based wind deductibles replace flat deductibles
- Carrier withdrawal — some insurers pulling out of high-risk states entirely
- Rebuild cost surge — materials and labor spike after major outbreaks
- Business interruption — lost rent, lost revenue, displaced tenants
Location Is Everything
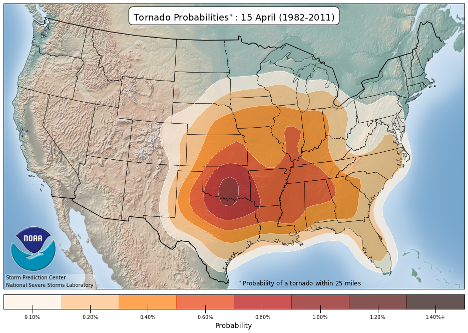
Tornado risk isn't evenly distributed. This NOAA Storm Prediction Center map shows annual tornado density across the United States — the greatest frequency runs from Texas and Oklahoma through Dixie Alley (Mississippi, Alabama, Tennessee, Arkansas), with activity tapering to the West Coast and far Northeast.
Two REITs with industrial or apartment exposure across the South can have wildly different storm profiles depending on which counties they actually sit in.
Source: NOAA Storm Prediction Center
How Tornadoes Form
A tornado is a violently rotating column of air that reaches from a thunderstorm down to the ground. They form when warm, moist air near the surface collides with cold, dry air above. That clash creates instability — warm air rockets upward, the storm starts spinning, and under the right conditions a funnel drops.
The most powerful tornadoes are rated EF4 or EF5 on the Enhanced Fujita Scale. [1] EF4 winds run from 166 to 200 mph. EF5 exceeds 200 mph. At those speeds, well-built homes don't survive. Cars become projectiles. Entire subdivisions are reduced to concrete slabs.
The U.S. averages more than 1,200 tornadoes per year — more than any other country. That's partly geography: nowhere else has the same collision of Gulf moisture, Rocky Mountain dryness, and cold Arctic air pushing south across flat land.
Where Tornadoes Are Redefining Real Estate
Most people picture Tornado Alley — Texas, Oklahoma, Kansas, and Nebraska. The 2013 Moore, Oklahoma EF5 tornado was nearly a mile wide, killing 24 people and causing $2 billion in damage in just 40 minutes. [2] The April 2011 Super Outbreak produced 360 tornadoes over four days — the largest outbreak ever recorded — killing 321 people and causing around $11 billion in losses. [3]
But the story has shifted. Dixie Alley — Mississippi, Alabama, Tennessee, and Arkansas — is now more active and in some ways more dangerous. Tornadoes here often strike at night, in hilly terrain that limits radar coverage, in communities with older homes and fewer safe rooms. The December 2021 outbreak killed over 80 people across Kentucky and neighboring states — one of the worst December tornado events on record.
What's consistent everywhere: insured losses from tornadoes have grown sharply in recent decades, driven by more development in exposed areas and a documented shift in where and when storms occur.
The Frequency Problem
Scientists debate whether climate change is increasing the total number of tornadoes, but evidence is strong that it's changing where and when they happen. Research published in npj Climate and Atmospheric Science shows tornado activity has shifted eastward — away from the Great Plains and into more densely populated areas. [4] The season is also becoming less predictable, with major outbreaks in months that historically saw little activity.
More people in the path. Less warning. Higher rebuild costs. That's the compound risk that real estate investors need to account for — and that most REIT indexes don't.
What Insurers Already Know
Unlike hurricanes, which give days of warning, tornadoes are nearly impossible to predict more than 15–20 minutes out. That makes rebuilding — not preparation — the insurance industry's primary cost. Rising labor and materials prices have pushed claims well above what insurers collected when policies were written. Several carriers have raised wind deductibles, introduced percentage-based deductibles, or pulled out of high-risk states entirely.
Insurance math, not politics
Insurers price tornado risk based on expected losses from catastrophe models, not beliefs about climate policy. When premiums spike or coverage disappears, it's a balance-sheet decision. The claims data is clear: more development in the tornado path means more expensive losses.
Why This Matters
REITs — real estate investment trusts — own physical buildings in specific locations. Industrial parks, apartment complexes, and retail centers across the South and Central U.S. carry tornado risk that doesn't show up in standard financial analysis. That's the property-level problem: where a building sits shapes what it's worth.
But portfolios have a second problem. A single outbreak can hit dozens of buildings in the same REIT, or many REITs in the same index, all in one night. That's correlated risk: bets that look different but move together when the sirens go off.
The index underlying VNQ (Vanguard Real Estate Index Fund ETF), and most other U.S. real estate funds, weights REITs purely by market capitalization. It doesn't look at how much of a REIT's portfolio sits in Dixie Alley, or how many REITs in the index share the same regional exposure.
The index methodology behind the Climate Global - Climate-Resilient REIT Index ETF (CLIM) is built differently. It uses the same catastrophe models insurers use — applied building by building across every REIT — and measures how much of a fund's exposure clusters on the same risk.
Learn more about Climate Global ETF. Click Here.>>
Sources:
[1] The Enhanced Fujita Scale (EF Scale). https://www.spc.noaa.gov/efscale/
[2] NOAA National Centers for Environmental Information (NCEI) U.S. Billion-Dollar Weather and Climate Disasters (2025). https://www.ncei.noaa.gov/access/billions/, DOI: 10.25921/stkw-7w73
[3] NOAA National Centers for Environmental Information (NCEI) U.S. Billion-Dollar Weather and Climate Disasters (2025). https://www.ncei.noaa.gov/access/billions/, DOI: 10.25921/stkw-7w73
[4] Gensini, V.A., Brooks, H.E. Spatial trends in United States tornado frequency. npj Clim Atmos Sci 1, 38 (2018). https://doi.org/10.1038/s41612-018-0048-2
Carefully consider the Funds’ investment objectives, risk factors, charges and expenses before investing. This and additional information can be found in the Fund’s Prospectus and Summary Prospectus, which may be obtained by visiting www.climateglobaletf.com. Read the Prospectus and Summary Prospectus carefully before investing.
The Fund is distributed by Foreside Fund Services, LLC. Exchange Traded Concepts, LLC serves as the investment advisor. The Fund is distributed by Foreside Fund Services, LLC., which is not affiliated with Climate Global, Exchange Traded Concepts, LLC, or any of its affiliates.
Investing involves risk, including possible loss of principal. The Fund’s return may not match or achieve a high degree of correlation with the return of the Index. To the extent the Fund’s investments are concentrated in or have significant exposure to a particular issuer, industry or group of industries, or asset class, the Fund may be more vulnerable to adverse events affecting such issuer, industry or group of industries, or asset class than if the Fund’s investments were more broadly diversified. Issuer-specific events, including changes in the financial condition of an issuer, can have a negative impact on the value of the Fund.
A new or smaller fund is subject to the risk that its performance may not represent how the fund is expected to or may perform in the long term. In addition, new funds have limited operating histories for investors to evaluate and new and smaller funds may not attract sufficient assets to achieve investment and trading efficiencies.
Shares are bought and sold at market price (closing price) not net asset value (NAV) and are not individually redeemed from the Fund. Market price returns are based on the midpoint of the bid/ask spread at 4:00pm Eastern Time (when NAV is normally determined) and do not represent the return you would receive if you traded at other times. Brokerage commissions will reduce returns.
