How Wildfire Affects Real Estate
The damage doesn't stop at the burn scar. Wildfire reshapes whole property markets.
- Structural loss — homes and commercial buildings destroyed outright
- Uninsurability — major carriers pulling out of whole zip codes
- Mortgage cut-off — without insurance, properties can't be financed or sold
- Value decline — prices fall as insurance becomes unavailable or unaffordable
- Rebuild risk — construction costs surge after major fire seasons
- Operating disruption — smoke, evacuations, and power shutoffs hit revenue
- Defensible-space costs — landscaping, hardening, and monitoring add up
Location Is Everything
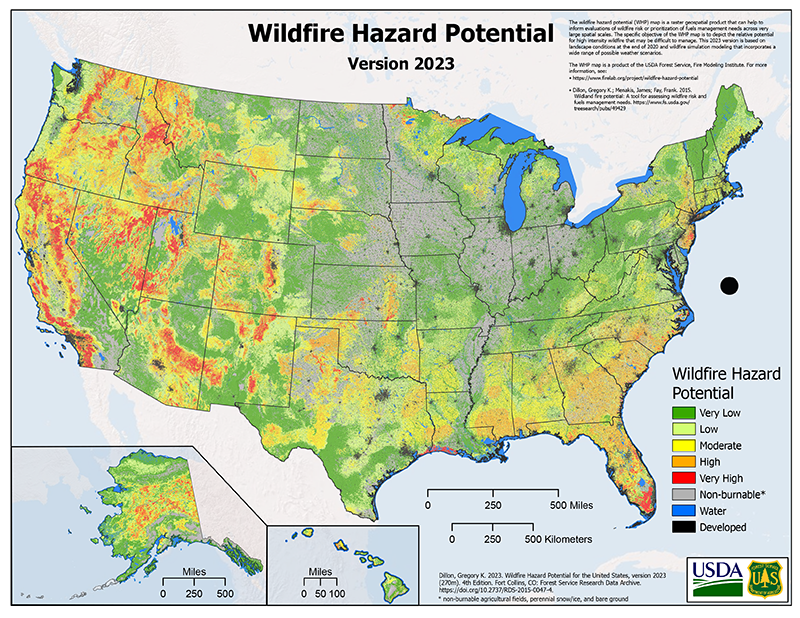
Wildfire risk is both regional and hyperlocal. Two different maps, two scales of analysis — and a market-cap index can't see either one.
Source: USDA Forest Service / Missoula Fire Sciences Lab
Regional — where the fuels and the climate line up
This U.S. Forest Service Wildfire Hazard Potential map puts the 2023 risk picture in one view. The high-risk zones run through California, the Sierra and Northern Rockies, Colorado's Front Range, parts of the Pacific Northwest, and pockets of the Southeast. A REIT with Sun Belt or Mountain West exposure is sitting in very different fire country than one concentrated in the Midwest.
Source: SILVIS Lab, UW-Madison / U.S. Forest Service
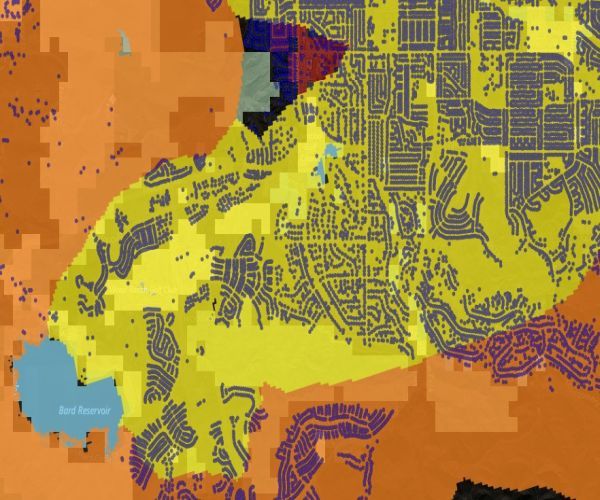
Hyperlocal — where the building actually sits
This SILVIS Lab map zooms into the wildland-urban interface — the zone where homes meet fire-prone vegetation. Roughly 46 million U.S. homes sit in or next to it. Within those regions, fire risk comes down to the building: two homes 200 feet apart can have very different risk — one on a cleared flat lot, another on a brushy ridge.
Catastrophe models see both scales at once. Market-cap indexes see neither.
How Wildfire Works — and Why It's Getting Worse
A wildfire needs three things: fuel, heat, and oxygen. Forests and grasslands that haven't burned in decades build up huge amounts of dry vegetation. Hotter summers and long droughts dry that fuel to record-low moisture. When a spark hits — a downed power line, a lightning strike, a hot engine on dry grass — fires spread faster and burn hotter than at any point in the modern record.
The average western U.S. fire season is now 105 days longer than it was in the 1970s. The Camp Fire that destroyed Paradise, California happened in November. The 2017 Thomas Fire burned from December into January. Fire season is now every season.
Where Wildfire Is Redefining Real Estate
California is where the crisis became impossible to ignore. The 2018 Camp Fire killed 85 people and destroyed nearly 14,000 homes in Paradise. [1] Damages exceeded $16 billion. The 2017 Wine Country fires cost another $18 billion. Together, those two years broke California's homeowner insurance market.
State Farm, Allstate, and Farmers all stopped writing new policies in California. The state's FAIR Plan — the insurer of last resort — nearly doubled its policy count in four years. Premiums in high-risk areas tripled or quadrupled. [2] In some communities, coverage became unavailable at any price.
The map is spreading well beyond the traditional West:
- Marshall Fire (Colorado, Dec 2021) — more than 1,000 homes destroyed in Boulder suburbs. The most destructive wildfire in Colorado history, burning through neighborhoods no one considered fire-prone.
- Smokehouse Creek Fire (Texas, 2024) — over a million acres in the Panhandle.
- Lahaina Fire (Maui, Aug 2023) — 101 people killed, most of a historic town leveled in hours. The deadliest U.S. wildfire in more than a century.
- Palisades and Eaton Fires (Los Angeles, Jan 2025) — more than 12,000 structures destroyed. The costliest U.S. wildfire event on record.
Fire country isn't just expanding across the mainland West. It's reaching communities that had no plan for it at all.
The Insurance Retreat
Insurance is the early-warning system for real estate. When an insurer exits a zip code, homeowners often find out at renewal — and by then, alternatives are limited and expensive. No insurance, no mortgage. No mortgage, no sale. That's how insurer withdrawal becomes property-value decline.
The FAIR Plan was never designed to be a primary market. It offers limited coverage at rising rates, and its solvency in a bad fire season is an open question. Private reinsurers — the companies that back the insurers — have been repricing western U.S. wildfire risk upward for years.
What Insurers Already Know
When State Farm exits California, they're not making a political statement. They're responding to catastrophe model outputs showing expected losses exceed what they can sustainably price. Their retreat is a pure economic signal — backed by decades of claims data and billions spent on modeling.
Insurance math, not politics
Insurance companies have the most economic skin in the game on wildfire. They commit capital, pay claims, and face insolvency if they get it wrong. When they leave a market, it's because the models demand it. You don't have to believe anything about climate change — just look at what insurers are doing with their own money.
Why This Matters
REITs — real estate investment trusts — own physical buildings in specific locations. A REIT with $5 billion in California WUI-adjacent properties faces completely different fire economics than one with $5 billion in the Midwest. That's the property-level problem: where a building sits shapes what it's worth.
But portfolios have a second problem. A single big fire season can damage dozens of buildings in the same REIT, or many REITs in the same index, all at once. That's correlated risk: bets that look different but move together when the sky fills with smoke.
The index underlying VNQ (Vanguard Real Estate Index Fund ETF), and most other U.S. real estate funds, weights REITs purely by market capitalization. It doesn't look at how much of a REIT's portfolio sits in the same fire corridor, or how many REITs in the index share the same California exposure.
The index methodology behind the Climate Global - Climate-Resilient REIT Index ETF (CLIM) is built differently. It uses the same catastrophe models insurers use — applied building by building across every REIT — and measures how much of a fund's exposure clusters on the same risk.
Learn more about Climate Global ETF. Click Here.>>
Sources:
[1] NOAA National Centers for Environmental Information, Monthly Wildfires Report for November 2018, published online December 2018, retrieved on May 29, 2026 from https://www.ncei.noaa.gov/access/monitoring/monthly-report/fire/201811. DOI: https://www.ncei.noaa.gov/access/metadata/landing-page/bin/iso?id=gov.noaa.ncdc:C00774
[2] California Department of Insurance, Commissioner Lara continues bold insurance reform agenda with landmark FAIR Plan modernization, July 26, 2024, https://www.insurance.ca.gov/0400-news/0100-press-releases/2024/release031-2024.cfm
Carefully consider the Funds’ investment objectives, risk factors, charges and expenses before investing. This and additional information can be found in the Fund’s Prospectus and Summary Prospectus, which may be obtained by visiting www.climateglobaletf.com. Read the Prospectus and Summary Prospectus carefully before investing.
The Fund is distributed by Foreside Fund Services, LLC. Exchange Traded Concepts, LLC serves as the investment advisor. The Fund is distributed by Foreside Fund Services, LLC., which is not affiliated with Climate Global, Exchange Traded Concepts, LLC, or any of its affiliates.
Investing involves risk, including possible loss of principal. The Fund’s return may not match or achieve a high degree of correlation with the return of the Index. To the extent the Fund’s investments are concentrated in or have significant exposure to a particular issuer, industry or group of industries, or asset class, the Fund may be more vulnerable to adverse events affecting such issuer, industry or group of industries, or asset class than if the Fund’s investments were more broadly diversified. Issuer-specific events, including changes in the financial condition of an issuer, can have a negative impact on the value of the Fund.
A new or smaller fund is subject to the risk that its performance may not represent how the fund is expected to or may perform in the long term. In addition, new funds have limited operating histories for investors to evaluate and new and smaller funds may not attract sufficient assets to achieve investment and trading efficiencies.
Shares are bought and sold at market price (closing price) not net asset value (NAV) and are not individually redeemed from the Fund. Market price returns are based on the midpoint of the bid/ask spread at 4:00pm Eastern Time (when NAV is normally determined) and do not represent the return you would receive if you traded at other times. Brokerage commissions will reduce returns.
